
Data Visualization & Technology
YPTC helps you visualize information clearly in ways that are easy to understand. We work with many kinds of quantitative data, including financials, program data, fundraising, and others, building custom infographics and dashboards that can be tailored for delivery in print, PDF, web pages, and mobile apps.

Let Us Introduce You To Your Data.
Data visualization and technology is essential for organizations to effectively communicate complex data insights facilitating informed decision-making.
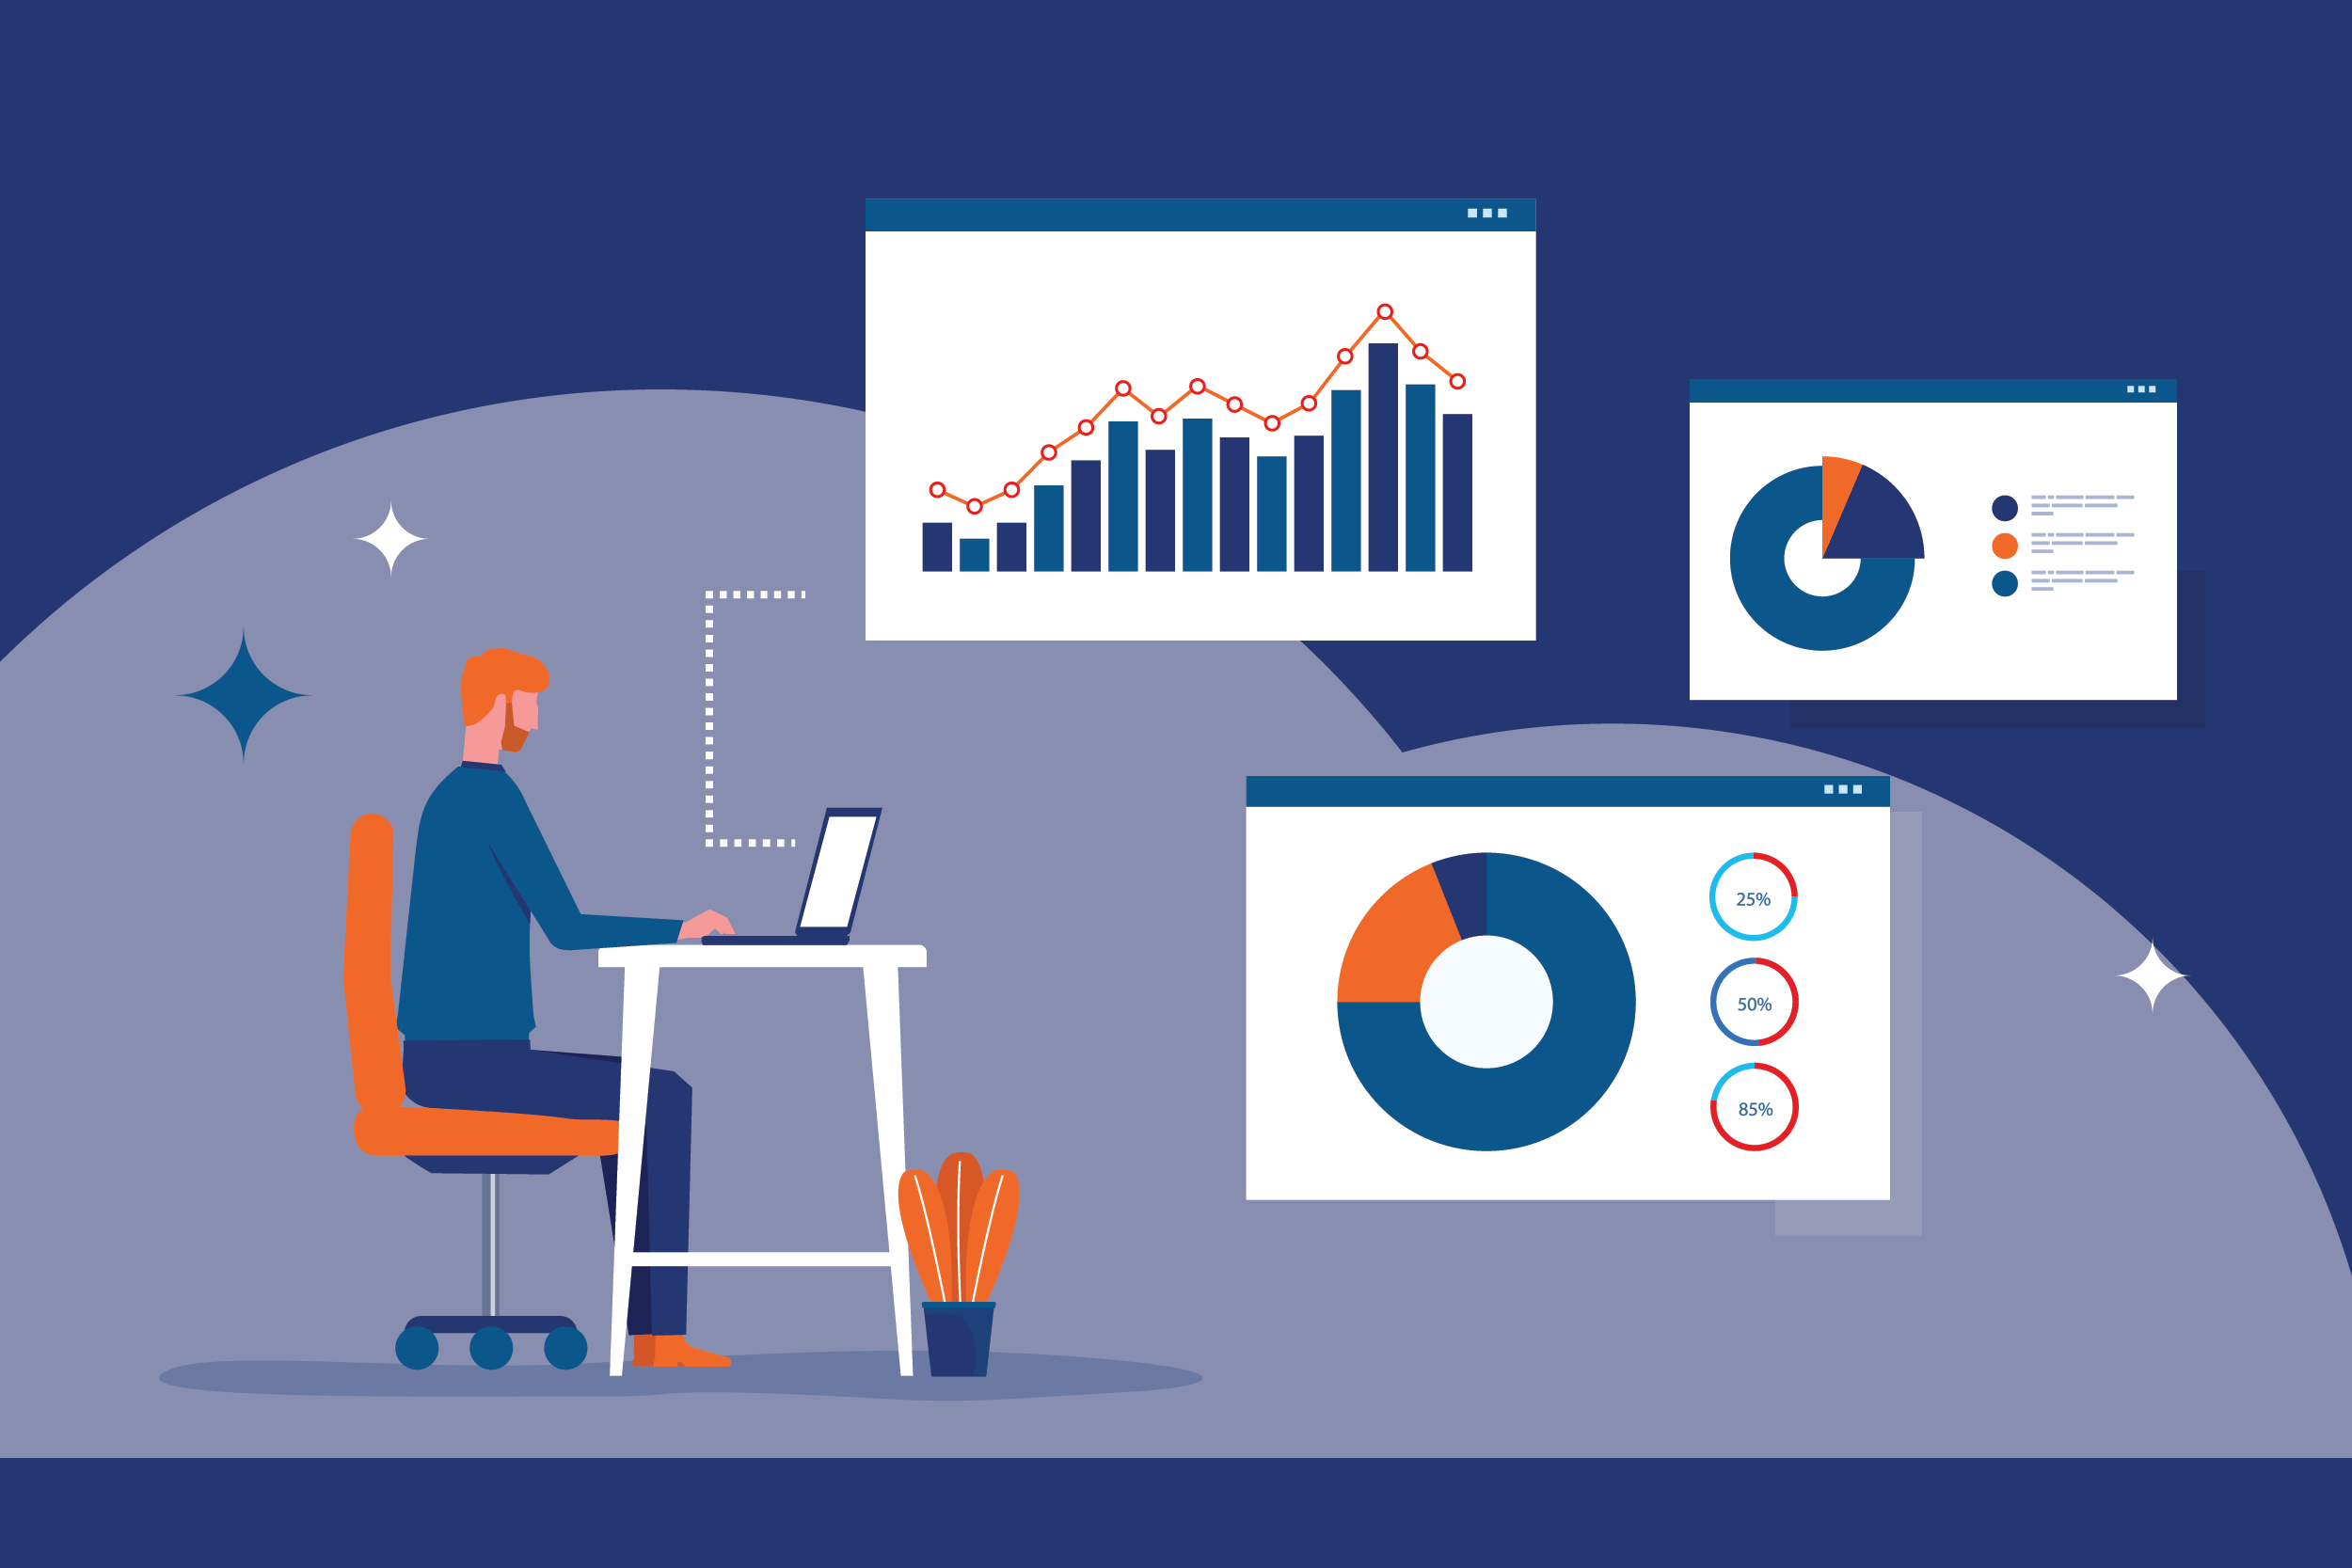
We help enhance your organization's data comprehension by presenting information in visually engaging formats such as charts, graphs, and interactive dashboards.
Get To Know Your Numbers, Personally.
Through visualization, organizations can identify patterns, trends, and outliers within their data more efficiently, leading to improved strategic planning and resource allocation.
Visual representations of data enable quicker and more accurate interpretation, fostering collaboration among teams and departments.


Go Confidently With Your Data By Your Side.
Utilizing data visualization services can also enhance the organization's ability to communicate its achievements, progress, and goals to external stakeholders, such as investors, clients, and the public.
More communication and understanding could lead to more success for your organization.
Want to Learn More?
More About Our Services
Free On Demand Webinar
Ready to Get Started? Contact Us!


